Highlights
Notable Content
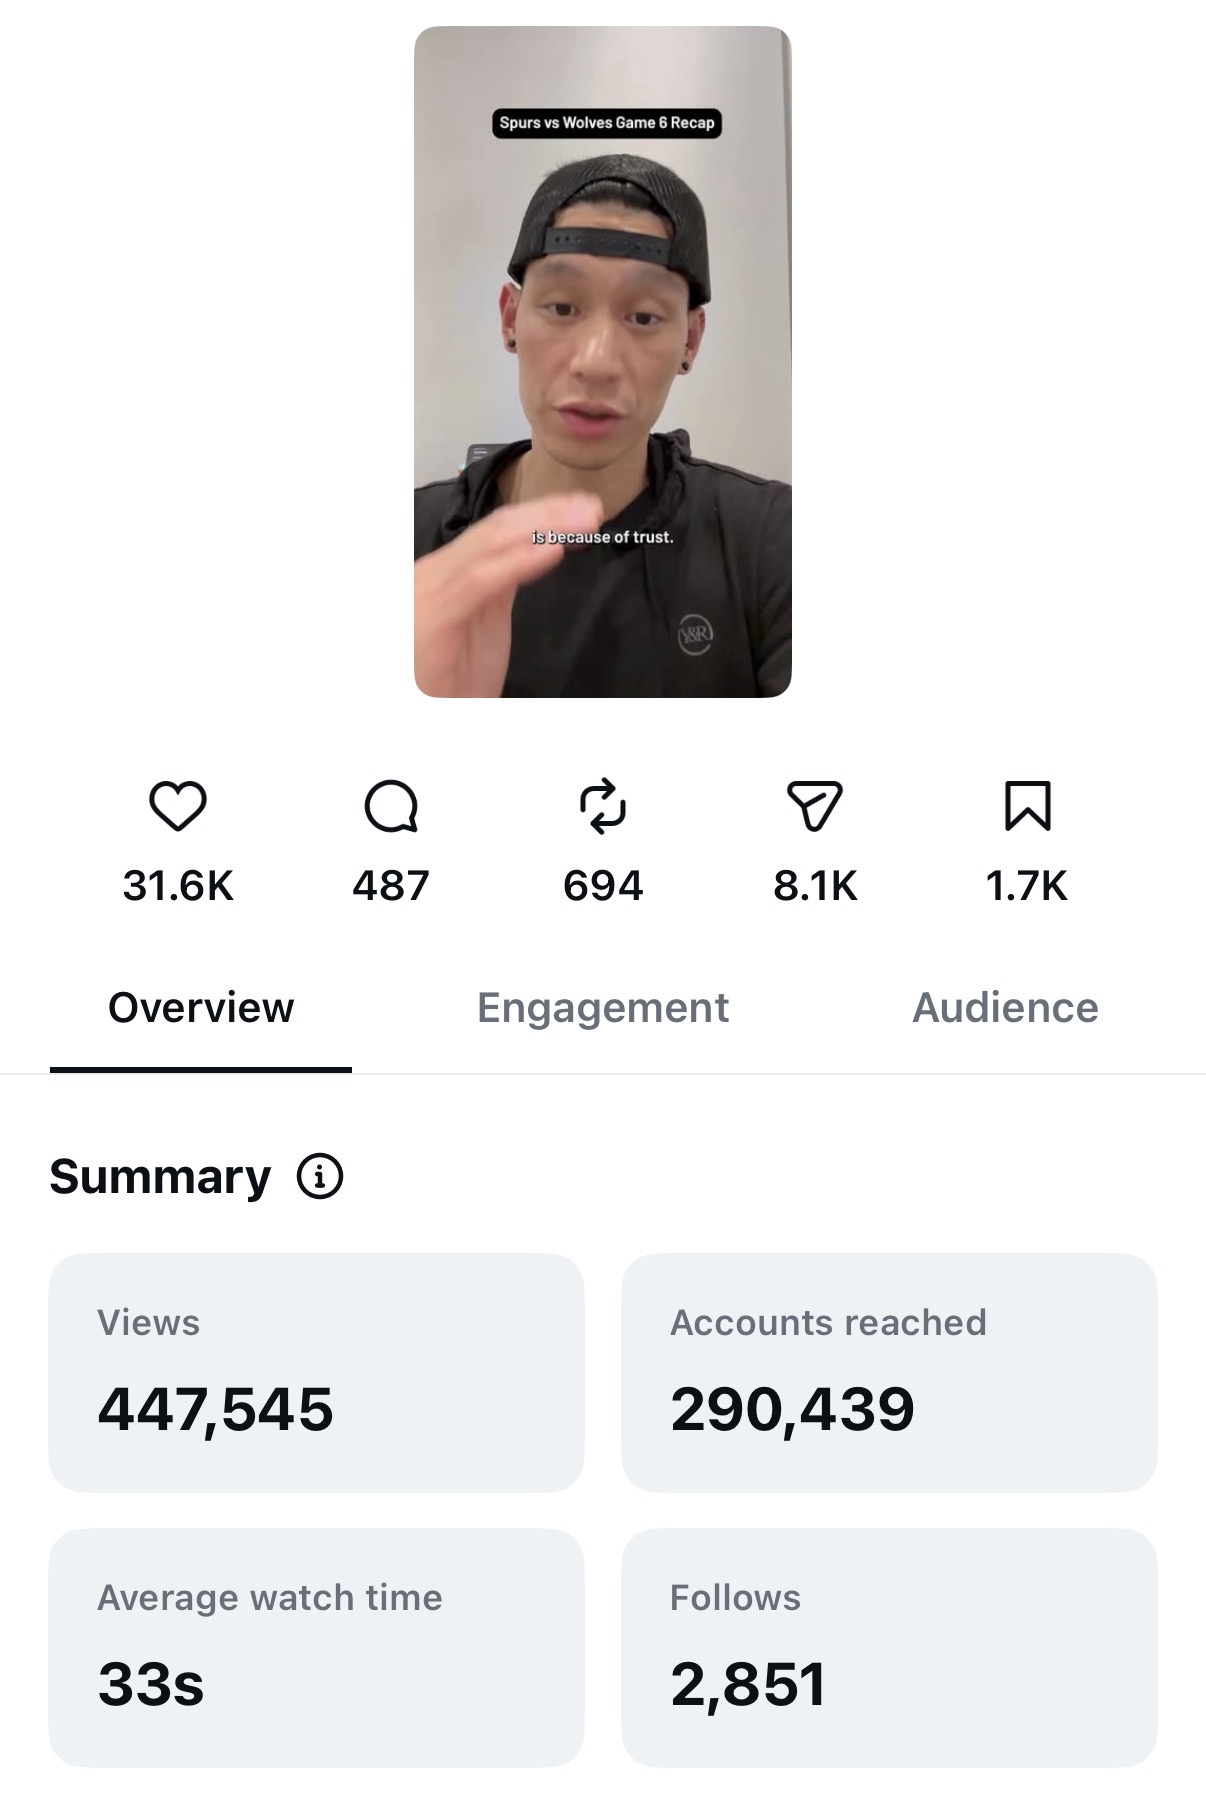
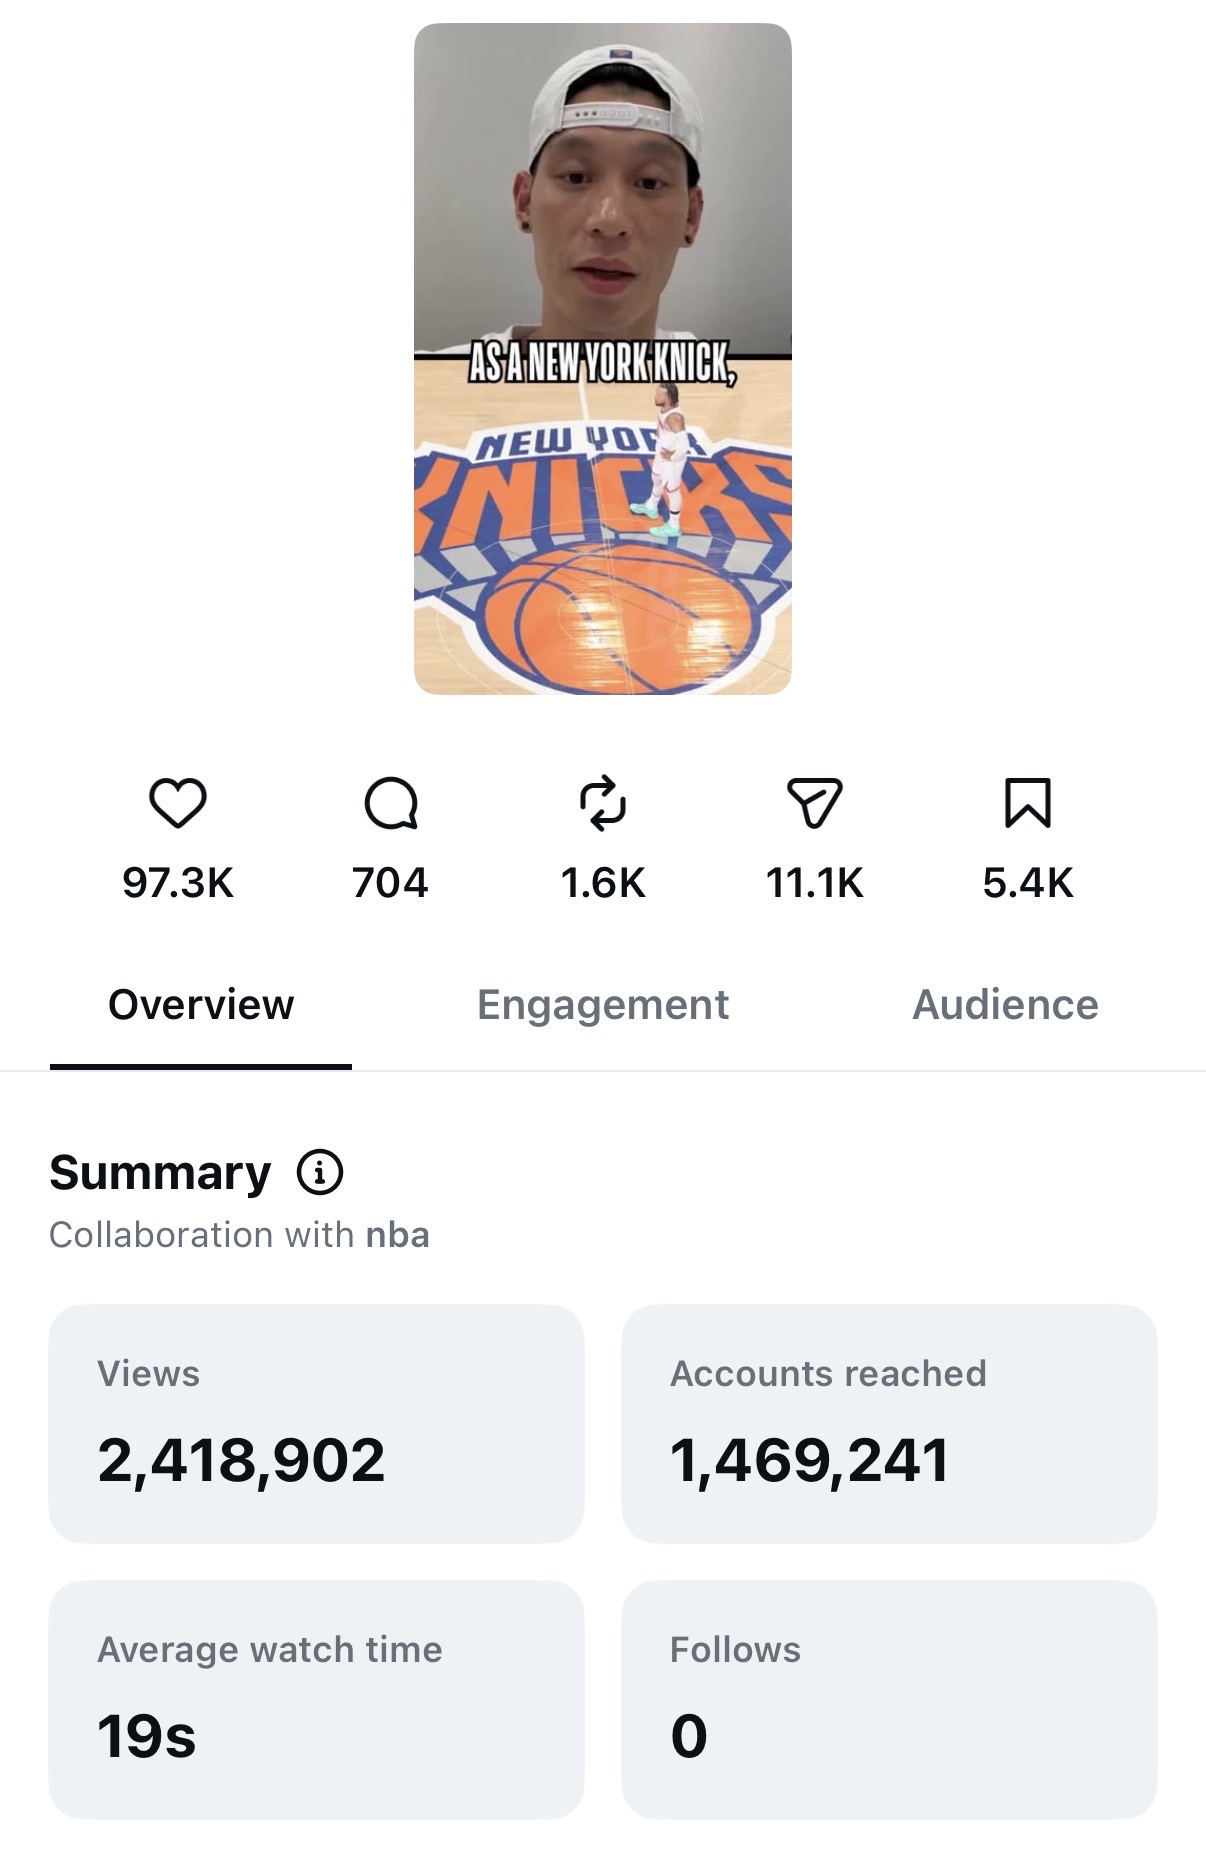
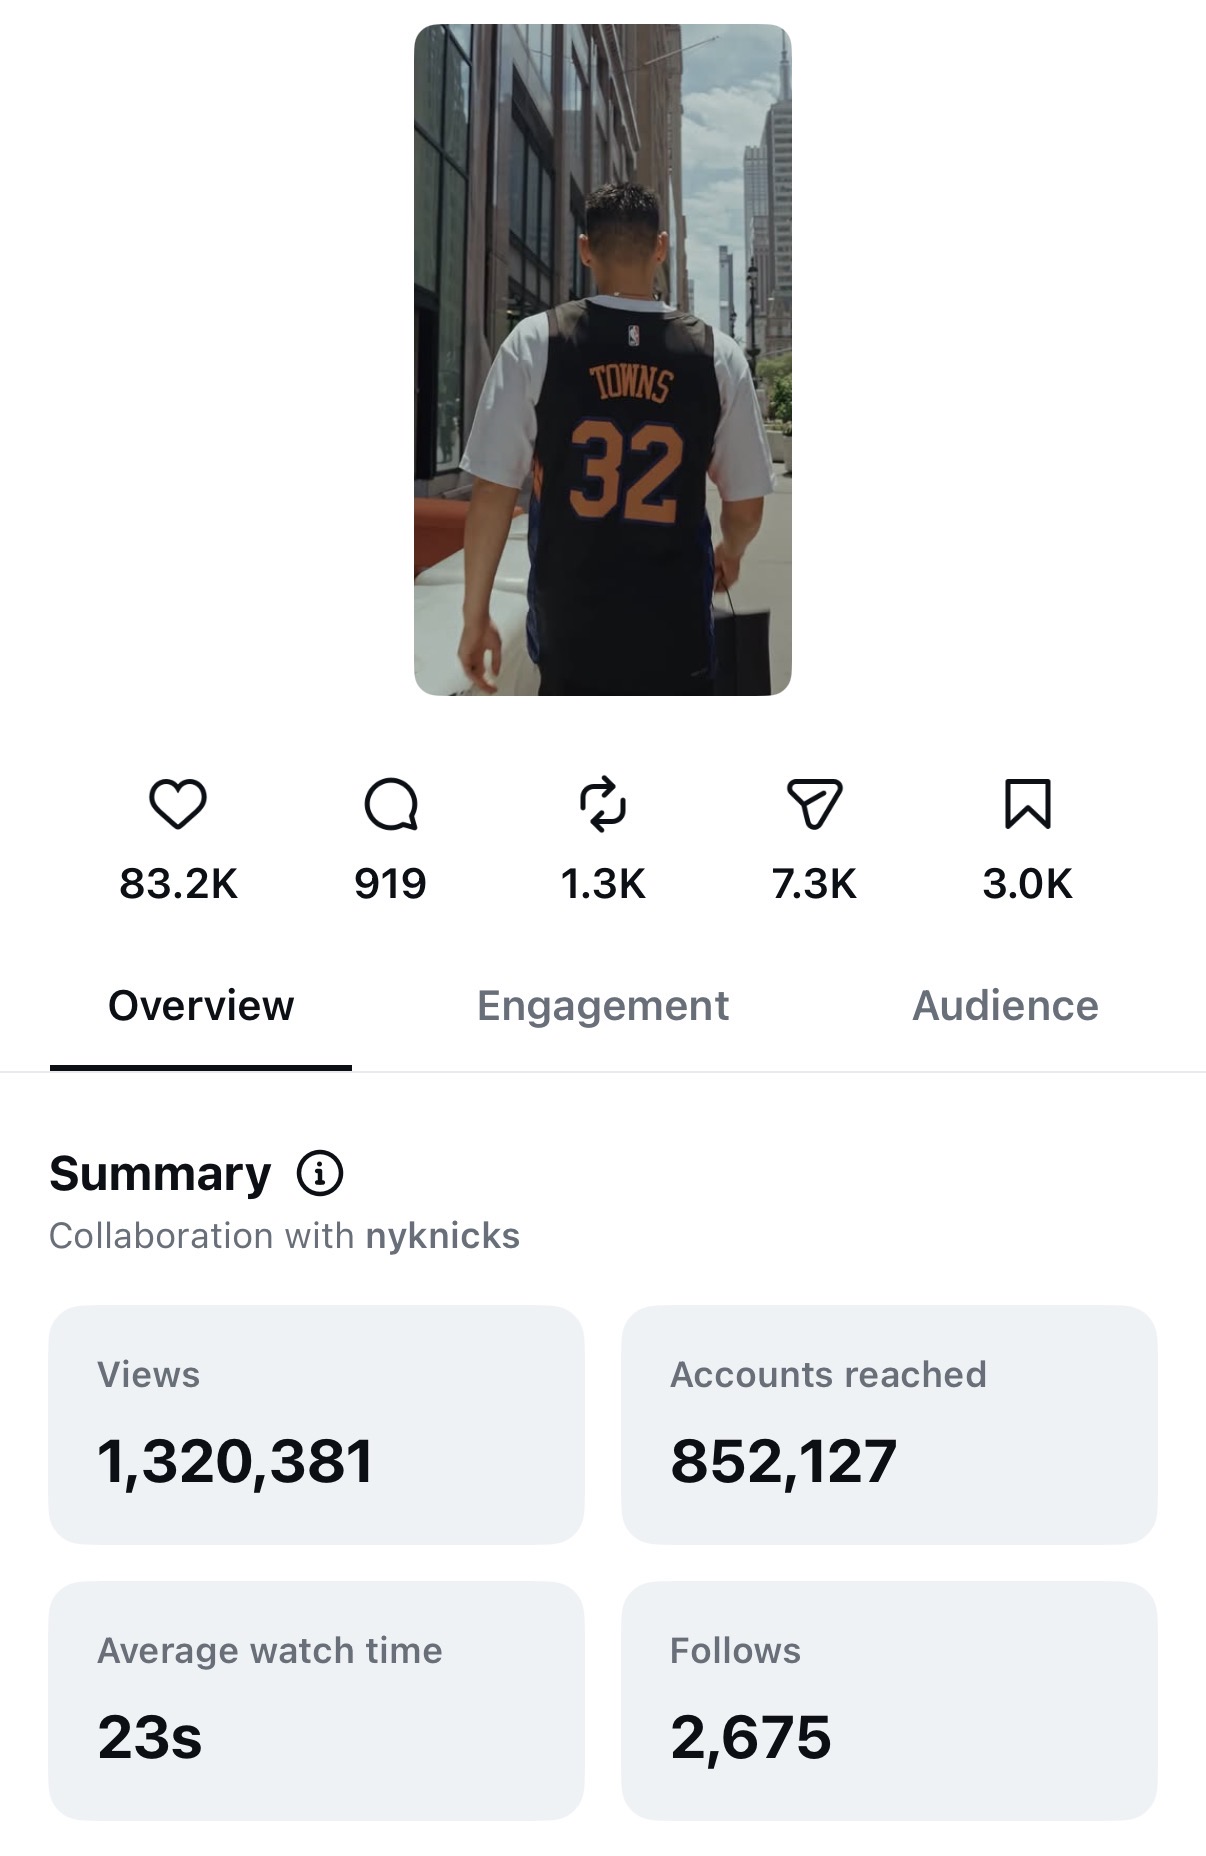
Top-performing posts this month — reach vs. platform average.
drop screenshot here
drop screenshot here
drop screenshot here
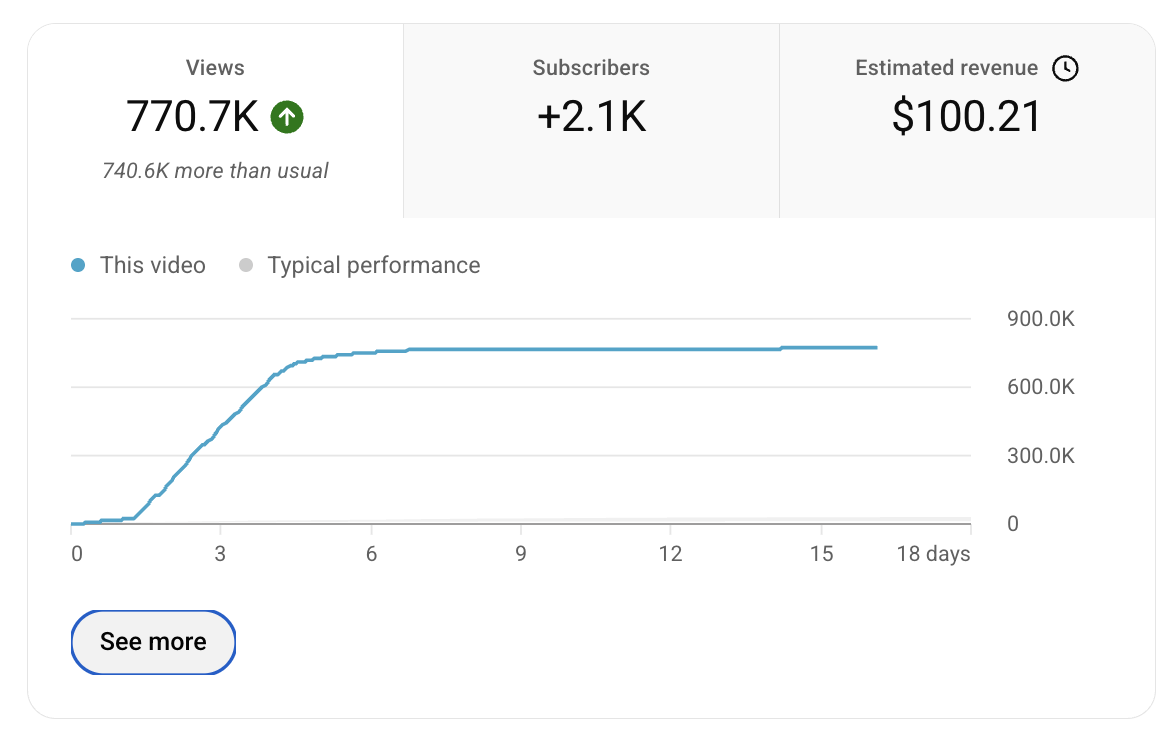
May was defined by consistent analysis clip performance and highlights from the NYC trip. The NYC NBA Store visit reached 768K views on Shorts — the 4th highest-viewed short on the channel ever — and drove 2,073 of the 3,481 new YouTube subscribers gained in May.
Instagram showed a significant follower drop on May 5–6 due to a platform-wide bot purge removing roughly 40K followers. Excluding that adjustment, organic follower gain for the month was approximately 17K. Own-initiated analysis clips drove more followers than the collab Knicks clip despite lower total views.
Had multiple collaborations and event-centric posts for AAPI Month including JLF, TAAF, Gold Gala, and AmaznHQ.

| Clip | Type | Total Views | IG Like Rate | Shares | Comments | Share Rate |
|---|